Examples
For in-depth description and additional information please refer to the supplement!
JAK-STAT signaling pathway
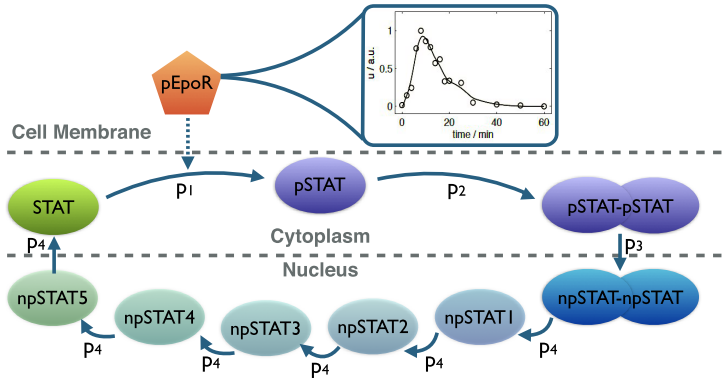
Schematic of the simplified JAK-STAT signaling pathway [1]. Upon activation, the Epo receptor triggers the phosphorylation of cytoplasmic STAT followed by dimerization and translocation of phosphorylated STAT into the nucleus.
The intermediate states npSTAT1 to npSTAT5 are used to model the delayed export of STAT from the nucleus.
CERENA can be used to describe the dynamics of JAK-STAT signaling pathway and proved to be more efficient than other packages/implementations.
This pathway is simulated using several modeling approaches, including stochastic simulation algorithms (SSA).
An example of a live correlation simulation can be viewed here.
The SSA simulation results were plotted and are depicted here.
Raue A, Kreutz C, Maiwald T, Bachmann J, Schilling M, Klingmüller U, et al. Structural and practical identifiability analysis of partially observed dynamical models by exploiting the profile likelihood. Bioinf. 2009 May;25(25):1923–1929.
The three-stage gene expression model
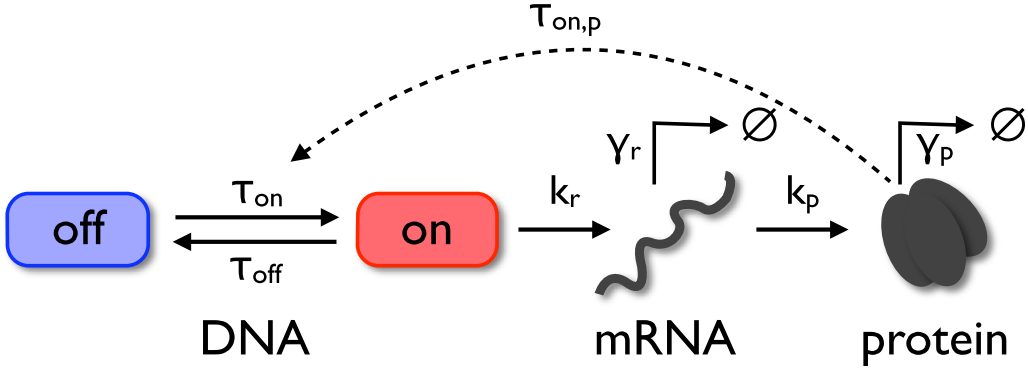
The three-stage gene expression model (Shahrezaei and Swain, 2008) is extended by a feedback loop to introduce a nonlinearity.
This model includes a gene with a promotor switching between on- and off-states. Transcription of mRNA takes place if the promotor is in the on-state, and the transcribed mRNA can be translated into protein.
The model also incorporates a protein-induced activation of the promoter which establishes a positive feedback loop.
This process was implemented and simulated in CERENA and yielded results which agree well with the reference solution.
The plots obtained by this example can be found here.
Shahrezaei V, Swain PS. Analytical distributions for stochastic gene expression. Proc Natl Acad Sci USA. 2008 Nov;105(45):17256–17261.
PapI regulation model
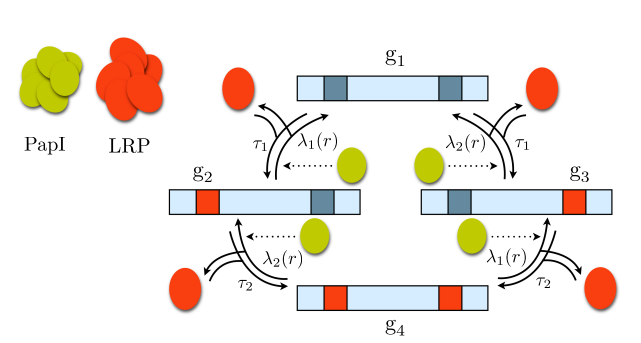
Schematic of the PapI regulation model.
Arrows represent the binding and unbinding of LRP to/from the operon. Dotted arrows indicate the influence of PapI on the reaction rates.
Only if the operon is in state g2 , pili can be produced. PapI sets up a a positive feedback loop for the production of pili by reducing the unbinding rate of LRP from the operon.
This process is an interesting application example as it involves non-polynomial propensity functions. The model definition and simulation files for this system can be found in CERENA/examples/PapI. The plots are illustrated here.
Kazeroonian A, Theis FJ, Hasenauer J. Modeling of stochastic biological processes with non-polynomial propensities using non-central conditional moment equation. In: Proc. of the 19th IFAC World Congress. vol. 19. Cape Town, South Africa; 2014. p. 1729–1735.