Examples: Plots
For in-depth description and additional information please refer to the supplement!
JAK-STAT signaling pathway
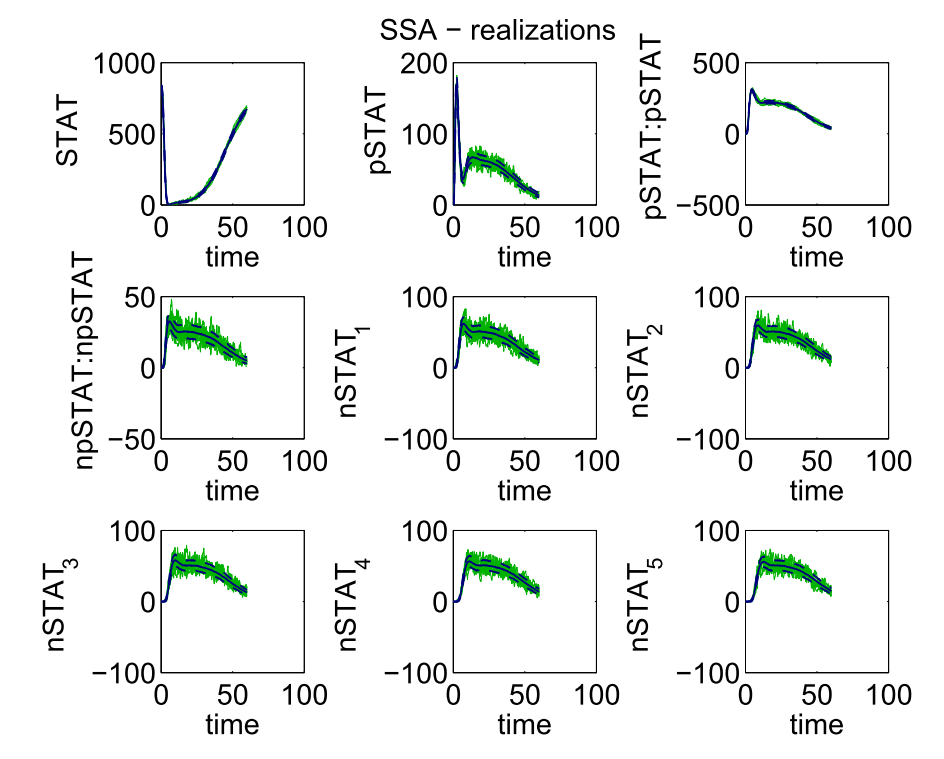
SSA simulation results for the simplified JAK-STAT pathway. Individual realizations (green) and the mean of the counts of species including 1-σ intervals (blue) are shown.
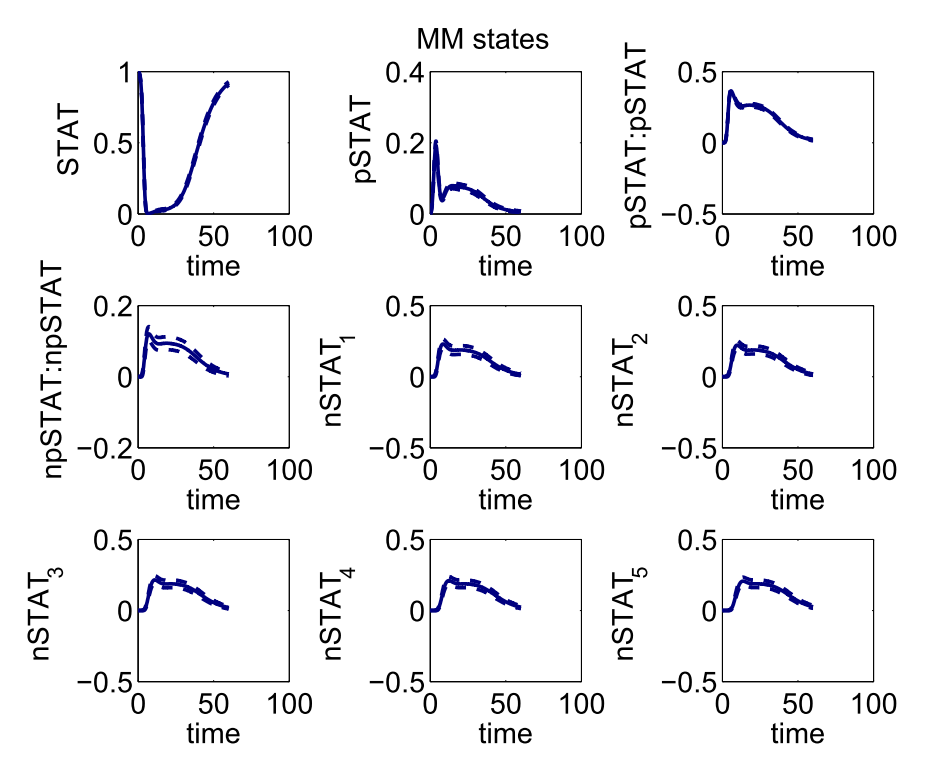
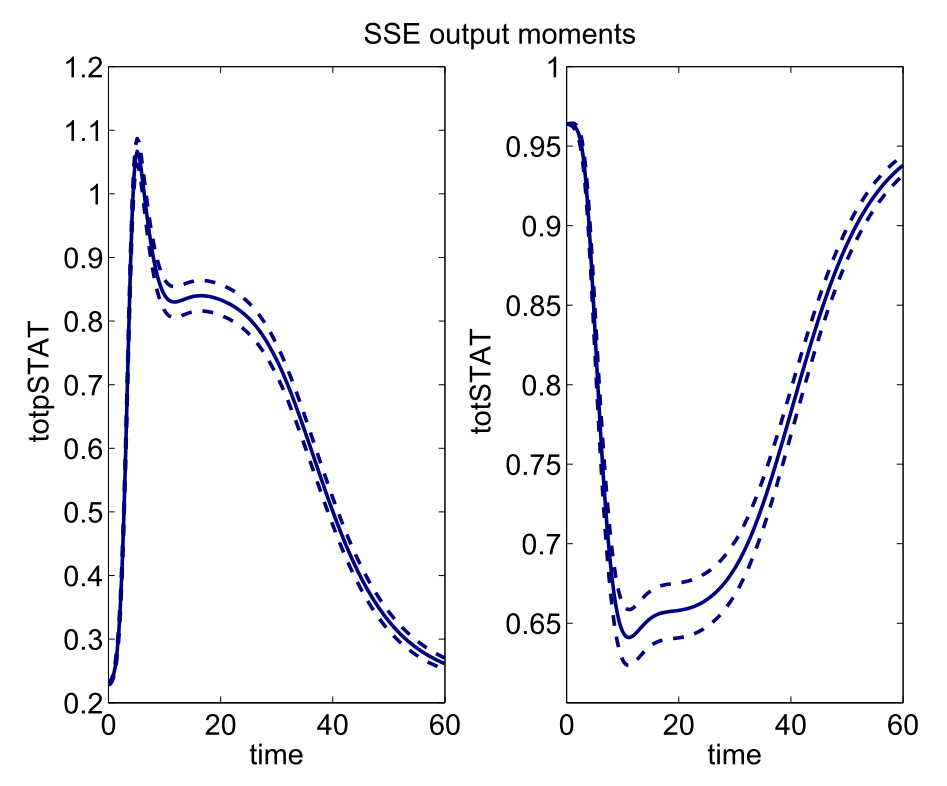
The counts of species and the concentration of the observable, i.e. total concentration of STAT, obtained by SSA simulation. The means, including 1-σ intervals, are shown.
The three-stage gene expression model
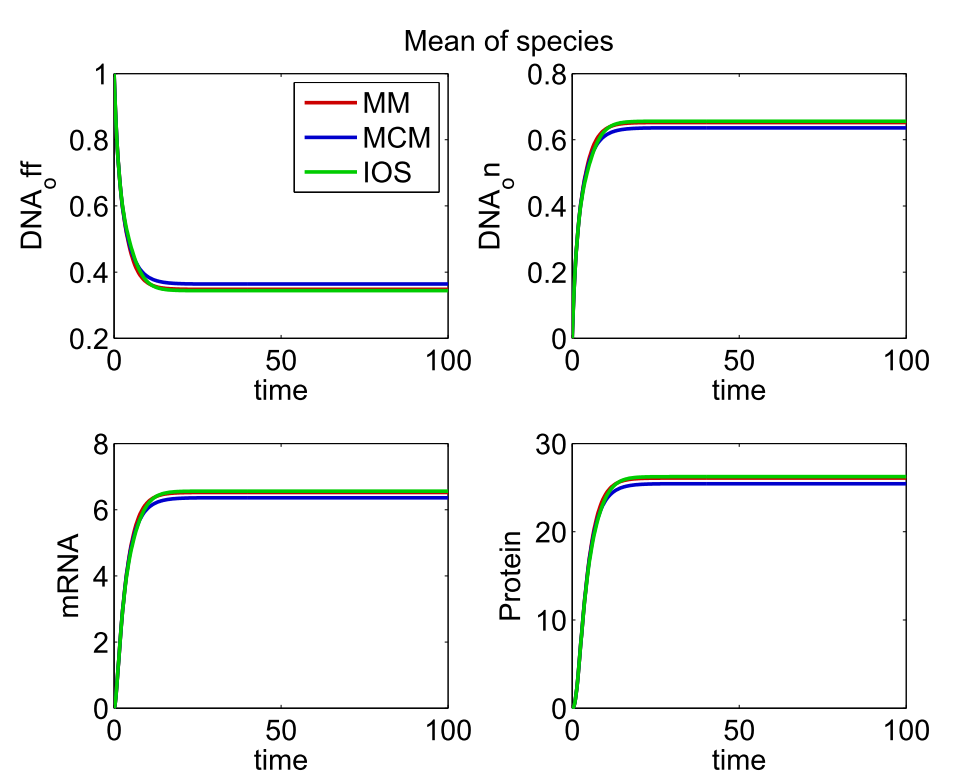
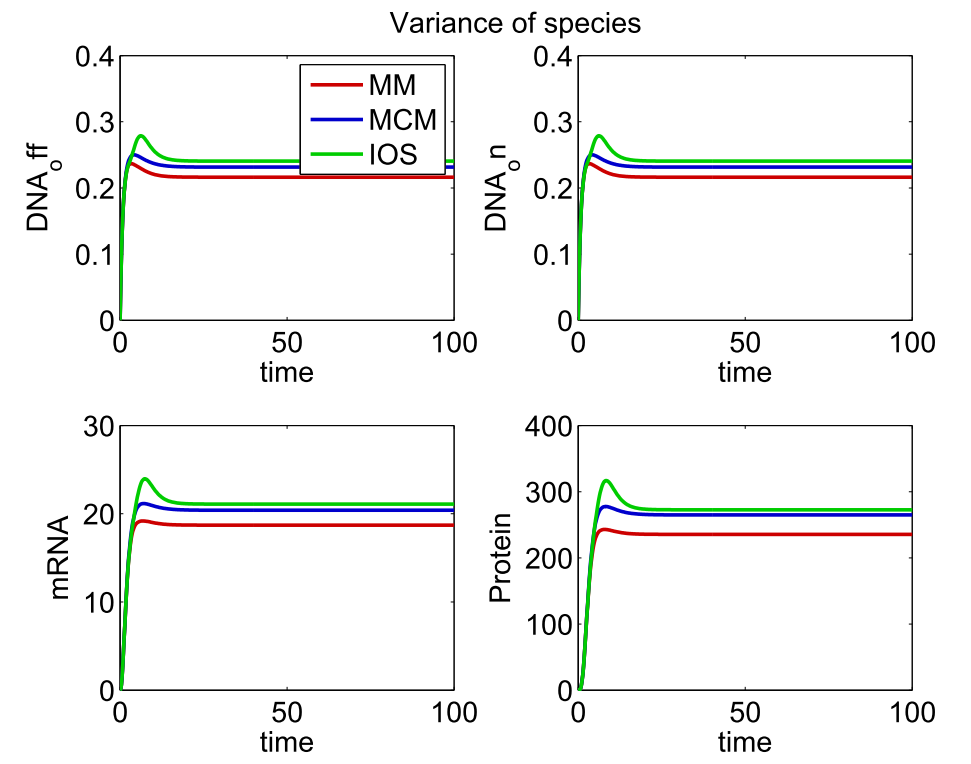
Mean and variance of species and output variables obtained by MM, MCM and IOS simulations.
PapI regulation model
